Debugging Tips
Flipper
Flipper is an extensible mobile app that is a platform for debugging iOS, Android, and React Native apps. Flipper is the default debugging tool for the Litho team. For more information, see the Flipper website.
Layout Inspector plugin
To setup the Layout Inspector Plugin in your project, refer to the Layout Plugin Setup page, which is part of the official Flipper website.
Thanks to Layout Inspector Plugin, you can inspect what views the hierarchy consists of as well as the properties of each view.
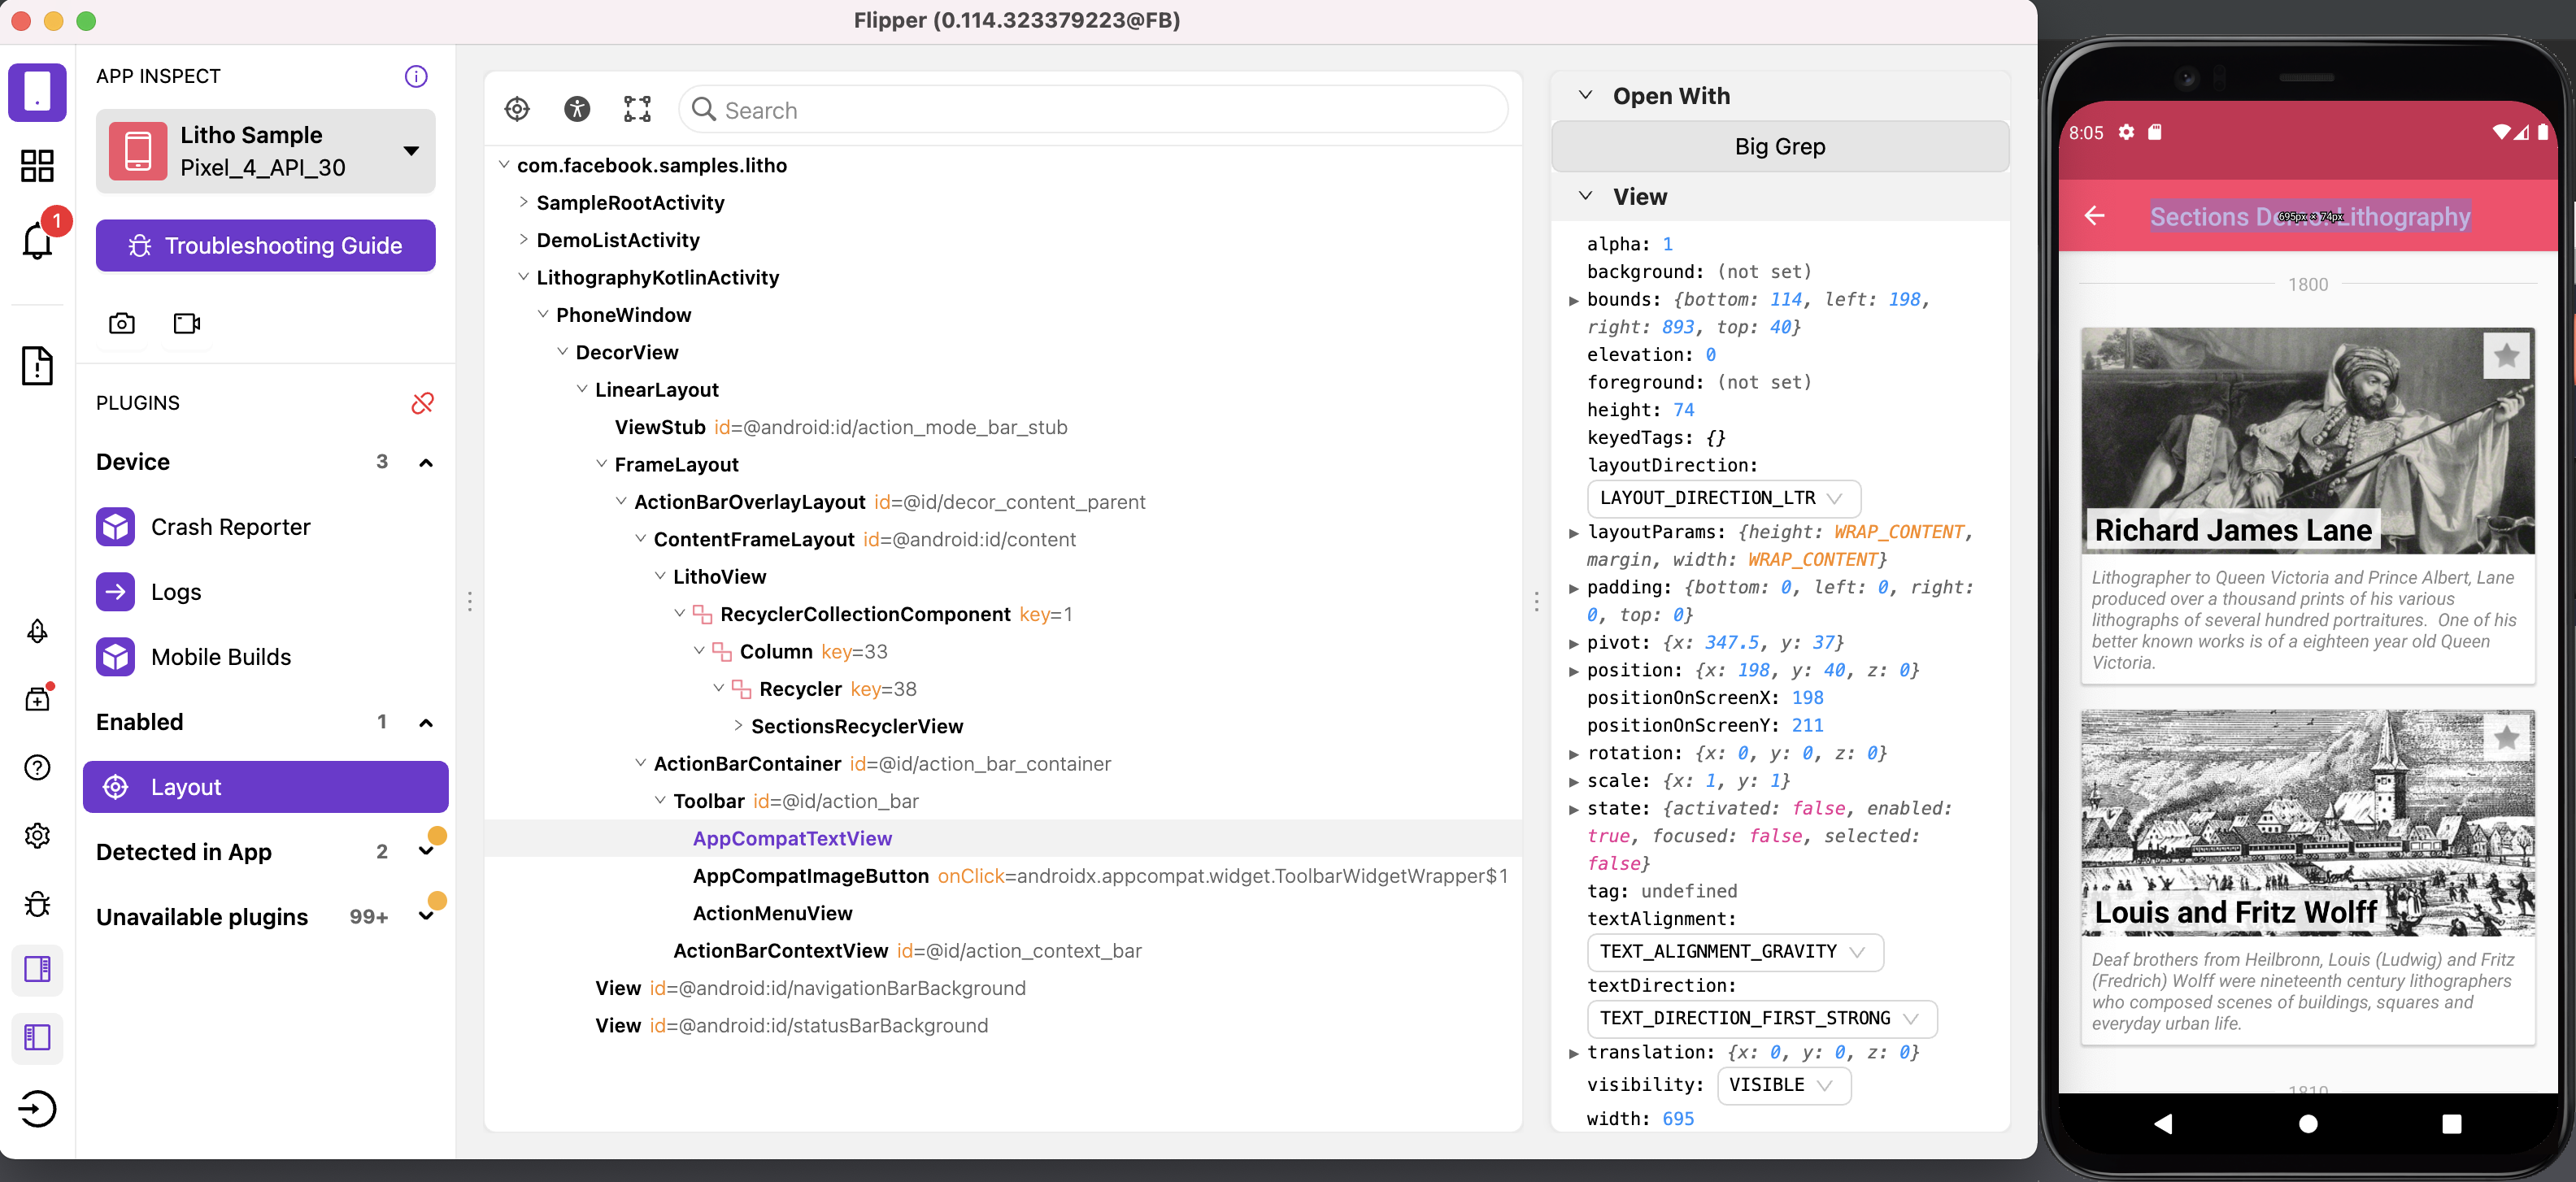
The Layout Tab presents components in the hierarchy as if they were native views (see the following image):
- On the right-hand side, you can see all of the properties and state of the given view.
- If you hover over a view or a component in Flipper, the corresponding item will be highlighted in your app.
This is perfect for debugging the bounds of your views and making sure you have the correct visual padding.
Quick edits
The Layout Inspector enables you to:
- View the hierarchy and inspect each item's properties.
- Edit items such as layout attributes, background colors, props, and state.
With these features, you can quickly tweak paddings, margins, and colors until you are happy with them, all without re-compiling. This can save you many hours when implementing a new design.
To edit a property, simply find the view through the layout hierarchy and edit its properties on the right-hand panel, as shown in the following short video.
Target Mode
Enable Target Mode by clicking on the crosshairs icon. Now, you can touch any view on the device and the Layout Inspector jumps to the correct position within your layout hierarchy, as shown in the following video.
Accessibility Mode
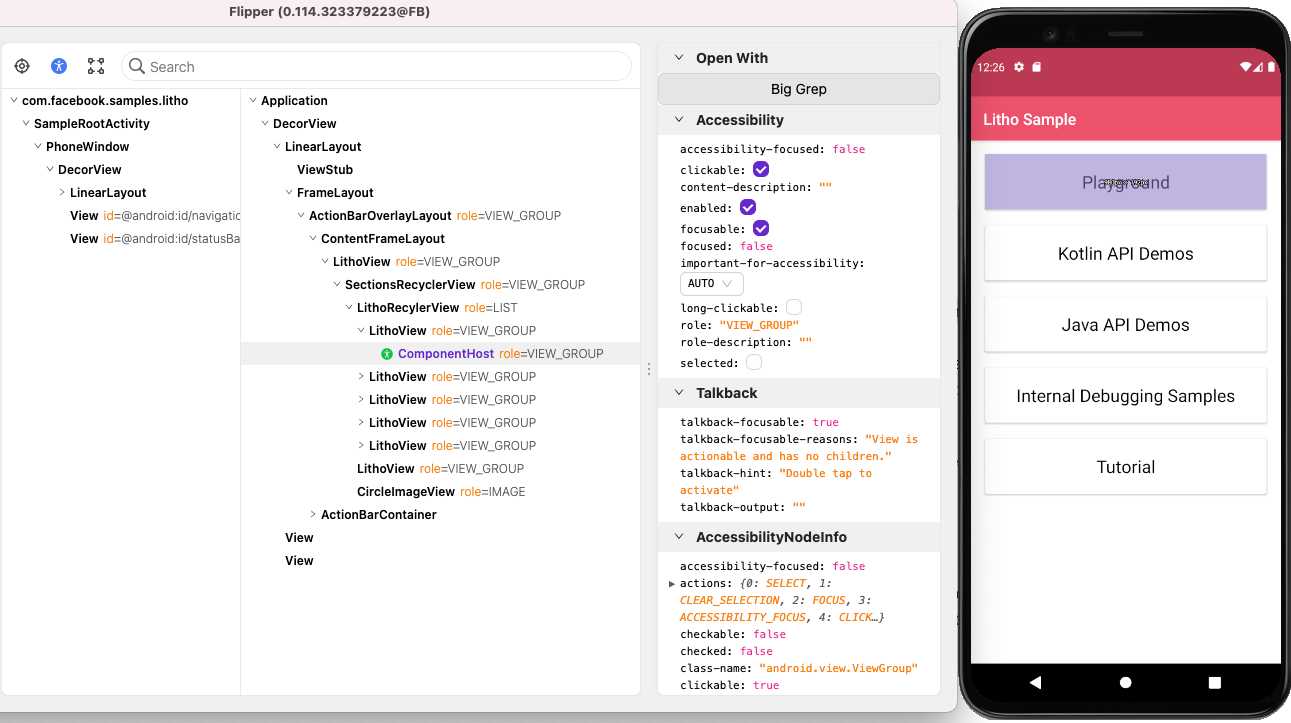
Enable Accessibility Mode by clicking on the accessibility icon. This shows the accessibility view hierarchy next to the normal hierarchy (see the image, below).
In the accessibility view hierarchy, the currently accessibility-focused view is highlighted in green, and any accessibility-focusable elements have a green icon next to their name.
When Accessibility Mode is enabled, the sidebar will show special properties that are used by accessibility services to determine their functionality. This includes items such as content-description, clickable, focusable, and long-clickable, among others.
Talkback
The Accessibility Mode sidebar also includes a panel with properties derived specifically to show Talkback's interpretation of a view (with logic ported over from Google's Talkback source). While generally accurate, this is not guaranteed to be accurate for all situations: it is always better to turn Talkback on for verification.
Sections plugin
The Sections plugin provides a view into sections tree generations and lifecycle events that render content on the screen.
With Sections Plugin you can:
- Track Sections lifecycle events.
- Show a stack trace for each state update that occurs in the section hierarchy.
- Visualize the Sections tree hierarchies.
- Inspect Render Sections hierarchies.
- Inspect Sections generated and applied changesets.
Once you open the plugin, it starts listening for all sections events that are triggered by the Sections. This might slow down the interaction with the app at first, but it should be smooth out after the first event has been tracked.
The plugin rationale is to create a collection of events that come with an attached stack trace. Every event can hold different information that is rendered on screen through either the Tree Data port view or the left Sidebar.
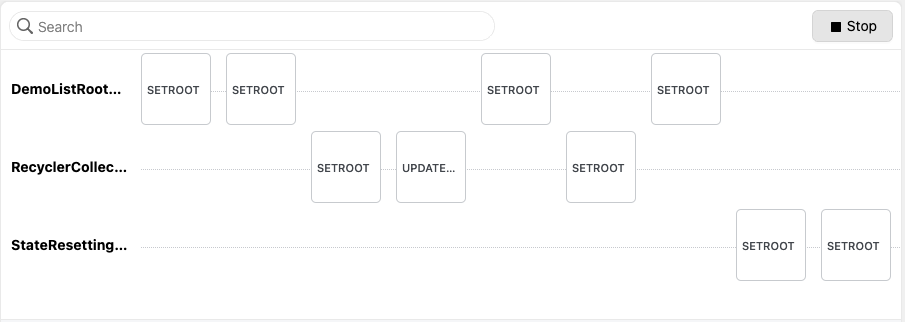
Events dashboard
The Events Dashboard (see the following image) collects all the relevant events that are sent by the following:
- Section component tracker.
- Object responsible to manage the lifecycle events of a Sections hierarchy.
- Sections Tree Analytics Listener, which is responsible for delivering information about the build steps for each tree generation.
Depending on the event that is selected, different information becomes available to the user.
Stack trace
For each event that gets selected, a stack trace is attached enabling you trace back who triggered the selected event.
Tree data
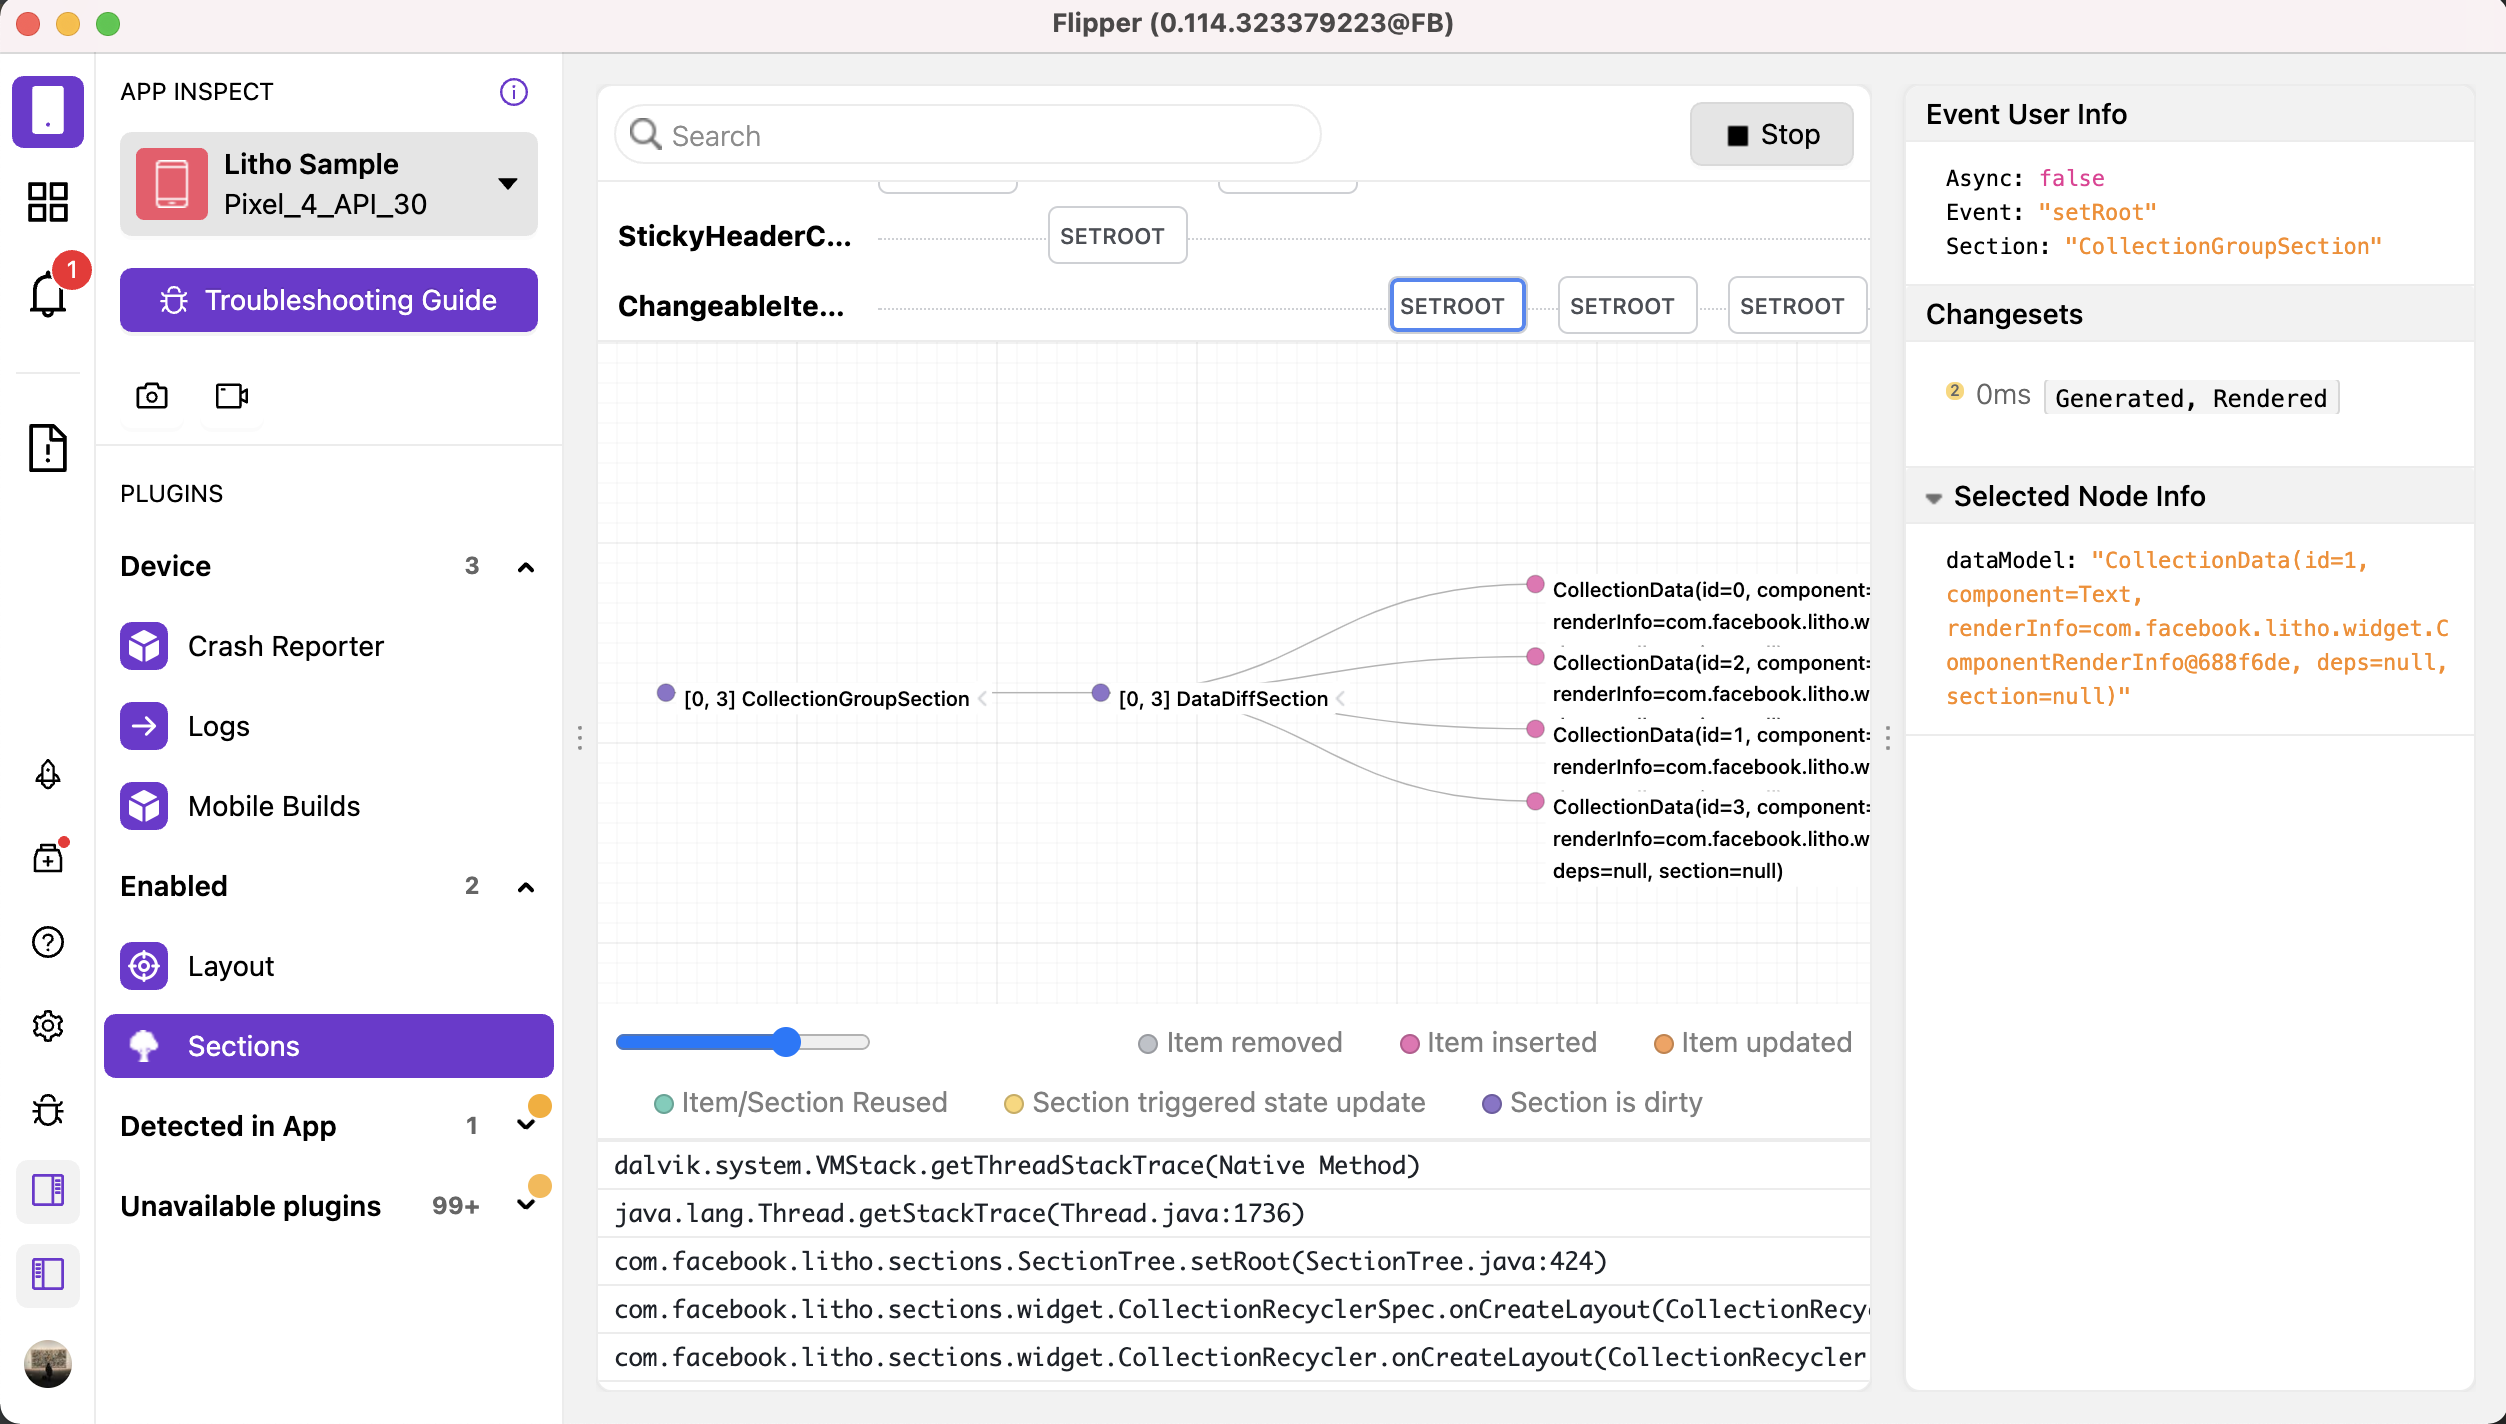
Tree Data visualises the available tree generation that comes with the selected event (see the following image).
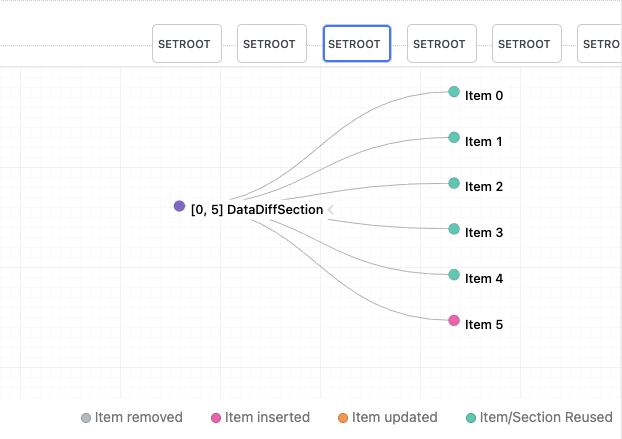
As seen the above image, you can analyse each item state between events and see if the item was:
- Removed
- Inserted
- Updated
- Reused
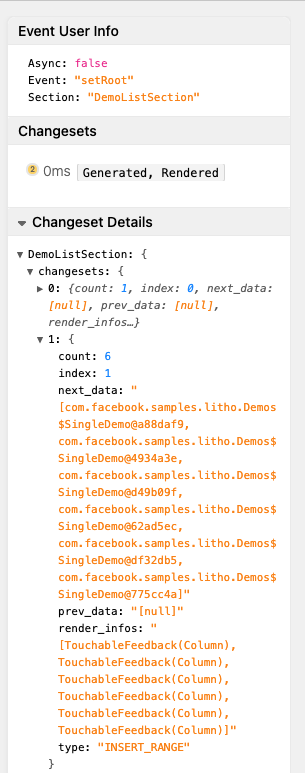
Changeset information
After a completed tree generation, every Section Component part of the Sections tree is queried for returning its changeset.
Changesets are reported on the right sidebar (as shown in the following image) with information about the type of change; they can be particularly useful for analysing what is happening with your Section:
- Insert
- Insert Range
- Update
- Update Range
- Delete
- Delete Range
- Move
Enable debugging logs
Currently there are three places where you can change the Boolean value to see more useful logs in logcat:
SectionsDebug - turning on the
ENABLEDflag enables the logs with the changesets that were calculated and expose which items were inserted, removed, updated or moved in your list. This can help answer questions such as "Why was my item re-rendered when nothing has changed?".ComponentTree - turning on the
DEBUG_LOGSflag enables the logs from theComponentTreeclass responsible for calculating, resolving, measuring and flattening the layout. This can help answer questions such as "Why is the UI not updating?" (Possibly, a layout calculation issue), "Why isn't my component visible, but is showing up in Flipper?" (Possibly, a Mounting problem wheremountwasn’t called for the layout result).AnimationsDebug - turning on the
ENABLEDflag will enable logs related to the Animations and Transitions.