Annotation Processor Debugging
Annotation Processor debugging is a three-step process:
1. Run the Compiler in Debug Mode
Using Gradle
Debugging the Annotation Processor stage is troublesome as you are essentially debugging the Java Compiler (javac). Gradle overcomes this issue by enabling you to attach a debugger, during the compilation stage, by setting the flag org.gradle.debug to true.
To use that flag, determine a target that invokes the annotation processor and start it, as shown in the following litho-widget example:
./gradlew --no-daemon -Dorg.gradle.debug=true :litho-widget:compileDebugJavaWithJavac
This will pause the execution during the Starting Daemon phase until you connect your debugger.
Using Buck
Buck doesn't have built-in support for suspending the compiler. However, you can attach a debugger by directly instrumenting the Java Virtual Machine (JVM) to open a debugging port.
For example, to trigger the Annotation Processor from the Sample App, use the following:
BUCK_DEBUG_MODE=1 NO_BUCKD=1 buck build //fbandroid/libraries/components/sample/src/main/java/com/facebook/samples/litho:litho
2. Set Breakpoints in the IDE
If you are not sure where to put breakpoints, the following classes might be a good start:
- BuilderGenerator - generates the builder for a Component.
- ComponentBodyGenerator - generates the implementation of a Component.
Breakpoints won't get hit if there are no code changes as Buck uses a cached built output; either call buck clean or make some changes in code.
3. Attach the Debugger to the Build Process
There are two options to attach the debugger: the Attach to process Menu Option menu option or Create a new debug configuration.
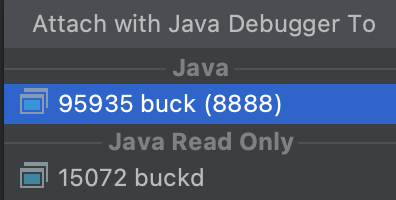
Attach to Process Menu Option
- Run -> Attach To Process - don't pick the 'Attach Debugger to Android Process' option!
- Wait for Android Studio to find the waiting Buck or Gradle process on the respective port (the same one used while creating the configuration).
- Select that option from the choices (see the following screenshot).
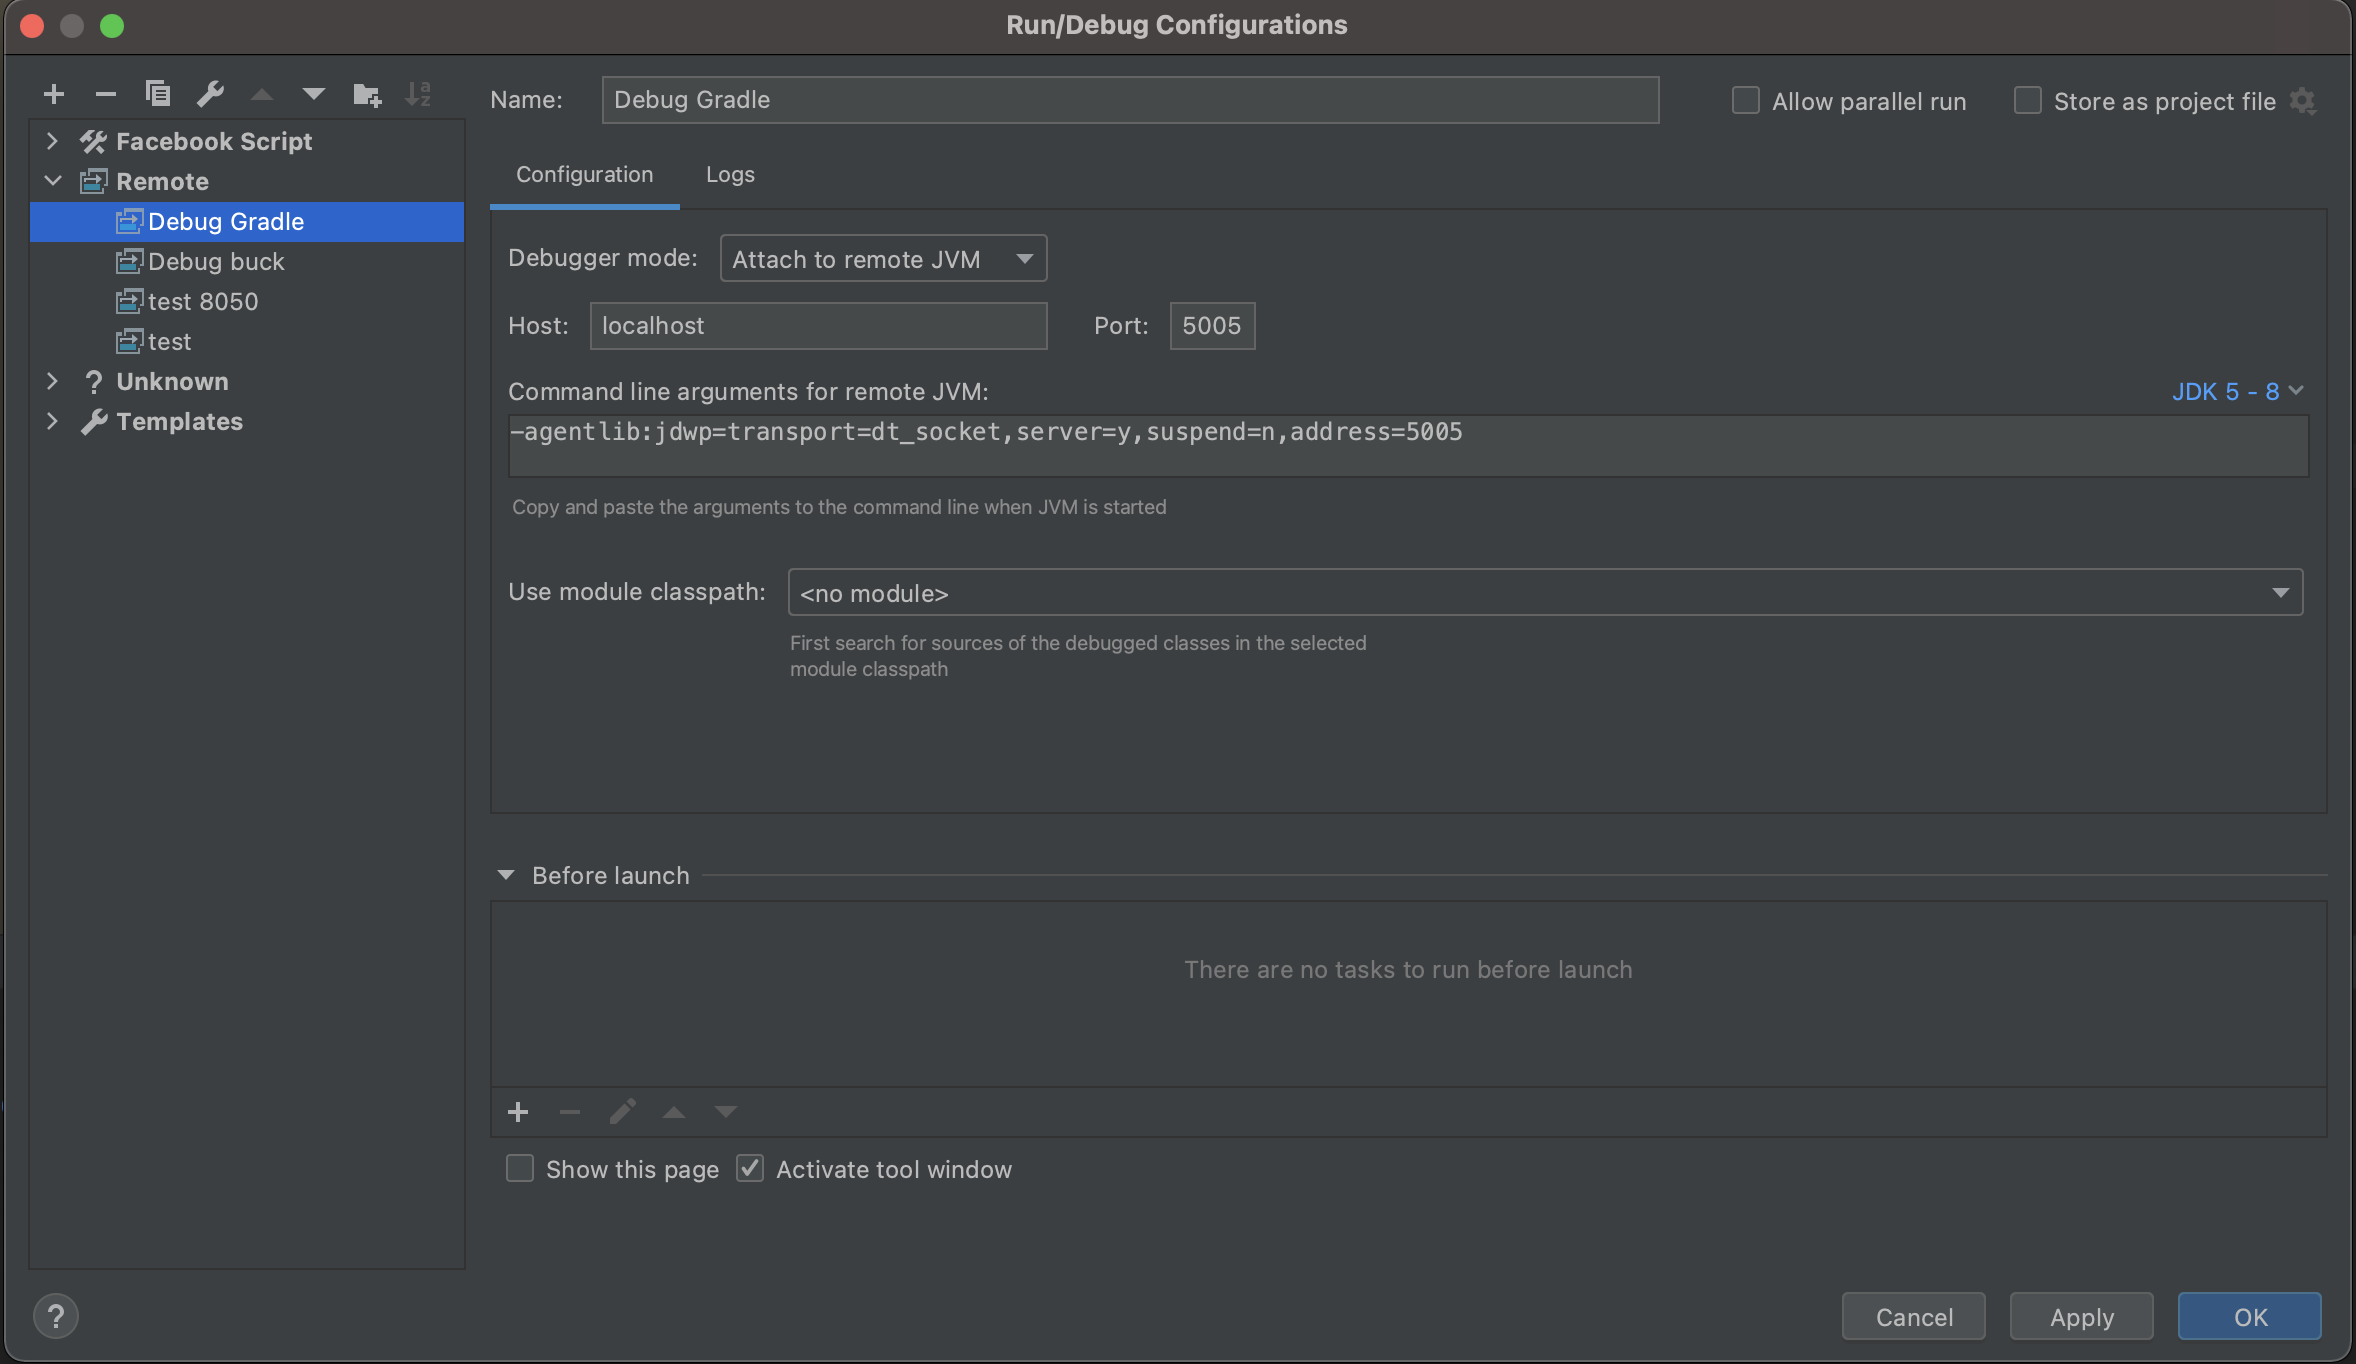
Create a new Debug Configuration
- Run -> Edit Configurations -> Add -> Remote
- Give it a name, such as 'Debug Gradle' or 'Debug Buck' (see the following screenshot)
- Debugger mode: Attach to remote JVM.
- Host: localhost.
- Port: 5005 (use the port number printed when running Gradle\Buck in debug mode in the previous step. Default: Gradle = 5005, Buck = 8888).
- Click 'OK' to create it.
- Select the new configuration from the Configuration dropdown.
- Click the 'Debug' Button.